One group of Americans that would love inflation is the borrowers. Borrowers have borrowed money in the form of loans from banks. They have to pay back the money they borrowed plus interest every month. If inflation occurs, the value of the money they borrowed goes down. If they owe $100,000 and pay it back during a time of inflation, the value of that $100,000 would actually be less than if it was not a time of inflation.
Friday, January 21, 2011
Post 24
Hopefully I will never have to experience any of the four types of unemployment. However, let’s just pretend that will happen.
Structural Unemployment- I decided to be a bookmobile driver. However, the library decided to stop having the bookmobile go around and instead moved all the books to the regular library. I was structurally unemployed.
Seasonal Unemployment- As a lifeguard, I experience seasonal unemployment every fall, winter, and early spring.
Frictional Unemployment- After college, I went into the workforce as a speech therapist, and because they have a 100% employment rate, I was quickly employed at a hospital. However I was soon offered a job in a school system which I prefer, so for a month after I left the hospital and before I was officially working for the school system, I was frictionally unemployed.
Cyclical Unemployment- During an economic recession, the school system in which I work layed off three of the five speech therapists and, unfortunately I was one of them. I was cyclically unemployed.
Wednesday, January 19, 2011


Post 22
1. Anyone who is not classified as either employed or unemployed is not in the labor force.
2. Marginally attached workers are people who once held productive jobs but have given up looking for work.
3. Discouraged workers are people who want jobs but have stopped looking for work for job-related reasons.
4. Frictional employment is unemployment attributed to workers moving from one job to another.
5. Regular fluctuations in jobs due to regular occurrences such as holidays, school schedules, and industry production schedules are called seasonal unemployment.
6. Aggregate supply is the total amount of goods and services produced throughout the economy.
7. Supply shocks result in overall higher prices.
8. To construct the consumer price index, the Bureau of Labor Statistics selects a sample of commonly purchased consumer items, called the market basket
9. The worst degree of inflation is called hyperinflation.
10. High interest rates can decrease consumer spending, particularly on goods that are usually purchased on credit.
11. Income inequality in the U.S. had become greater than in any other large industrialized country.
12. The poverty threshold is the lowest income level that a family needs to maintain a basic standard of living.
13. A Lorenz Curve illustrates the amount that a nation's distribution of income varies from a perfectly proportional distribution of income.
14. The data used to plot a Lorenz Curve can also be used to compute the Gini Index. The Gini Index is another statistical measure of income inequality.
15. Rapid changes in technology have led to a drop in demand for lower-skilled workers.
Tuesday, January 18, 2011
Post 21
National Income Accounting: A variety of measures of national income and output are used in economics to estimate total economic activity in a country or region, including gross domestic product (GDP), gross national product (GNP), and net national income (NNI).
Gross Domestic Product: the measure of an economy adopted by the United States in 1991; the total market values of goods and services produced by workers and capital within a nation's borders during a given period (usually 1 year)
Output expenditure model: total output responds to the demand for it.
Personal Consumption expenditure: the component statistic for consumption in GDP collected by the BEA. It consists of the actual and imputed expenditures of households and includes data pertaining to durable and non-durable goods, and services
Gross Investment: the measure of investment used to compute GDP. This is an important component of GDP because it provides an indicator of the future productive capacity of the economy
Nominal GDP: GDP as actually measured, thus in current dollars
Real GDP: a macroeconomic measure of the size of an economy adjusted for price changes (that is, adjusted for changes in the value of money: inflation or deflation
Price Index: an index that traces the relative changes in the price of an individual good (or a market basket of goods) over time
Underground Economy: refers to both legal activities, such as often found in construction and services industries where taxes are not withheld and paid, and illegal activities, such as drug dealing and prostitution
Gross National Product: former measure of the United States economy; the total market value of goods and services produced by all citizens and capital during a given period (usually 1 yr)
Business Cycle: recurring fluctuations in economic activity consisting of recession and recovery and growth and decline
Expansion: In business cycle, economic growth
Peak: In business cycle, height of economic prosperity
Contraction: In business cycle, a period of economic decline marked by falling real GDP
Recession: a recession is a business cycle contraction, a general slowdown in economic activity over a period of time
Depression: a sustained, long-term downturn in economic activity in one or more economies
Trough: Lowest point in economy
Leading Indicators: indicators in economics and finance used to predict the future
Lagging Indicators: indicators in economics and finance used to measure the past
Coincident Indicators: is a statistic about the economy. Economic indicators allow analysis of economic performance and predictions of future performance. One application of economic indicators is the study of business cycles.
Real GDP Per Capita: related to all economic indicators that are calculated, usually at the end of a fiscal year
Labor Productivity: Workforce productivity is the amount of goods and services that a labourer produces in a given amount of time.
Productivity Growth: a measure of output from a production process, per unit of input
Capital-to-labor ratio: For example, labor productivity is typically measured as a ratio of output
Capital Deepening: a term used in economics to describe an economy where capital per worker is increasing. This is also referred to as increase in the capital intensity.
Thursday, January 13, 2011
Post 20
PART 1
5) my answer: Lagging Indicator, Real Answer Business Cycle, page 501 The business cycle is a recurring pattern in economic activity that is characterized by alternating periods of expansion and contraction.
6) My answer: Blank, Real answer: Trough, page 511 Trough is the lowest point of the business cycle.
8) My answer: Leading Indicators, Real Answer Lagging Indicators, page 506 Lagging Indicators are a set of economic factors that help economists predict the duration of economic upturns and downturns.
9) My answer capital to labor ration, real answer Labor Productivity, page 506 Labor productivity is a measure of how much each worker produces in a given period of time.
PART 2
7) My answer: coincident, Real answer: leading, page 506 Leading indicators are economic factors that anticipate the expansions and contractions of the business cycle.
PART 3
3) My answer: A, Real Answer D, Page 232, A price index is a set of statistics that allows economists to compare prices over time.
5) My answer: A, real answer: B, Page 236, In the business cycle, expansion describes economic growth.
10) My answer: A, real answer D, The level of available technology, quantity of capital goods available per worker, and the skill level of the work force all have a significant impact on the productivity growth.
PART 4
2) My answer: I, real answer: B, Nominal GDP is GDP expressed in the current prices of the period being measured.
3) My answer: T, real answer: P, A set of statistics that allows economists to compare prices over time is a price index.

Wednesday, January 5, 2011
Post 18
Mr. Campbell asked us to visit a site of a teacher he follows on Twitter. The teacher's website has many links on it that have to do with economics. My job was to be an investigator and find three websites I would like to use on the midterm. Here they are along with an explanation as to why I chose them.
Link #1
This is the first website I would like to use on the midterm even though, hopefully I will be exempt. It is a huge dictionary of economics terms. The midterm is bound to have questions that have vocabulary words imbedded in them and vocabulary terms as answers. This website will be an aide if the student does not know what some of those words are. It is organized in a concise, easy to use fashion and seems to be very helpful.
This is the second website I would like to use on the midterm. This website would be immensely helpful as an aide on the midterm. On the left side of the site, there are links to other parts of the site that would actually be the most helpful. The “concept” and the “support resources” links seem to be the most helpful. While investigating these links I found numerous helpful pages. I have found glossaries, descriptions of concepts and many helpful tools. The site is also organized very well. This site would be very helpful while taking the economics midterm.
This is the final site I would pick if I could use three websites on the midterm. It seems to go over most of the topics we have covered this semester. The links on the site go to pages about economic principles, supply and demand, economic systems, economic policy, corporations and stocks, and a few other economic topics. Many of the lessons we have had this year have been on those topics, so this website will be very helpful on the midterm.
Tuesday, January 4, 2011
Post 17
This graph does explain the business cycle, however it does not use the vocabulary terms that the other graphs use, so I can not award this graph the Best Business Cycle Graph Award.
This graph is better explains the business cycle. The parts of the graph are clearly labeled with the correct economic terms, such as peak and trough. The graph is very clear and to the point. This graph was a good contender for the award, however just did not make the cut. With a few more bells and whistles, this graph could have won; however I would like it to be clear that this graph does explain the business cycle very well.

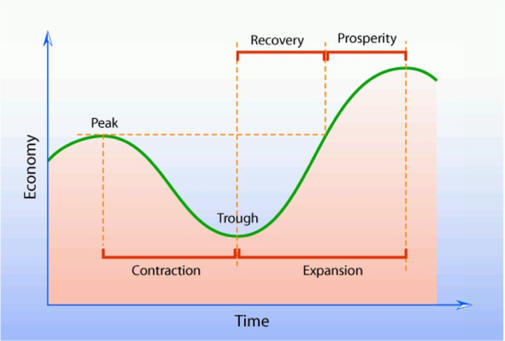
I have to award this graph the title of Best Business Cycle Graph because in addition to using all the correct terms, this graph just goes above and beyond. The colors and dotted lines just make the graph more detailed and easier to understand. It not only includes the four normal vocab words, it goes above and beyond to include other words to help the person understand the business cycle. I applaud this graph.

This graph is better explains the business cycle. The parts of the graph are clearly labeled with the correct economic terms, such as peak and trough. The graph is very clear and to the point. This graph was a good contender for the award, however just did not make the cut. With a few more bells and whistles, this graph could have won; however I would like it to be clear that this graph does explain the business cycle very well.
I have to award this graph the title of Best Business Cycle Graph because in addition to using all the correct terms, this graph just goes above and beyond. The colors and dotted lines just make the graph more detailed and easier to understand. It not only includes the four normal vocab words, it goes above and beyond to include other words to help the person understand the business cycle. I applaud this graph.
Monday, January 3, 2011
Post 16
This link will go to a set of flash cards that will help me prepare for the chapter 10 test. Flash Cards
Subscribe to:
Posts (Atom)